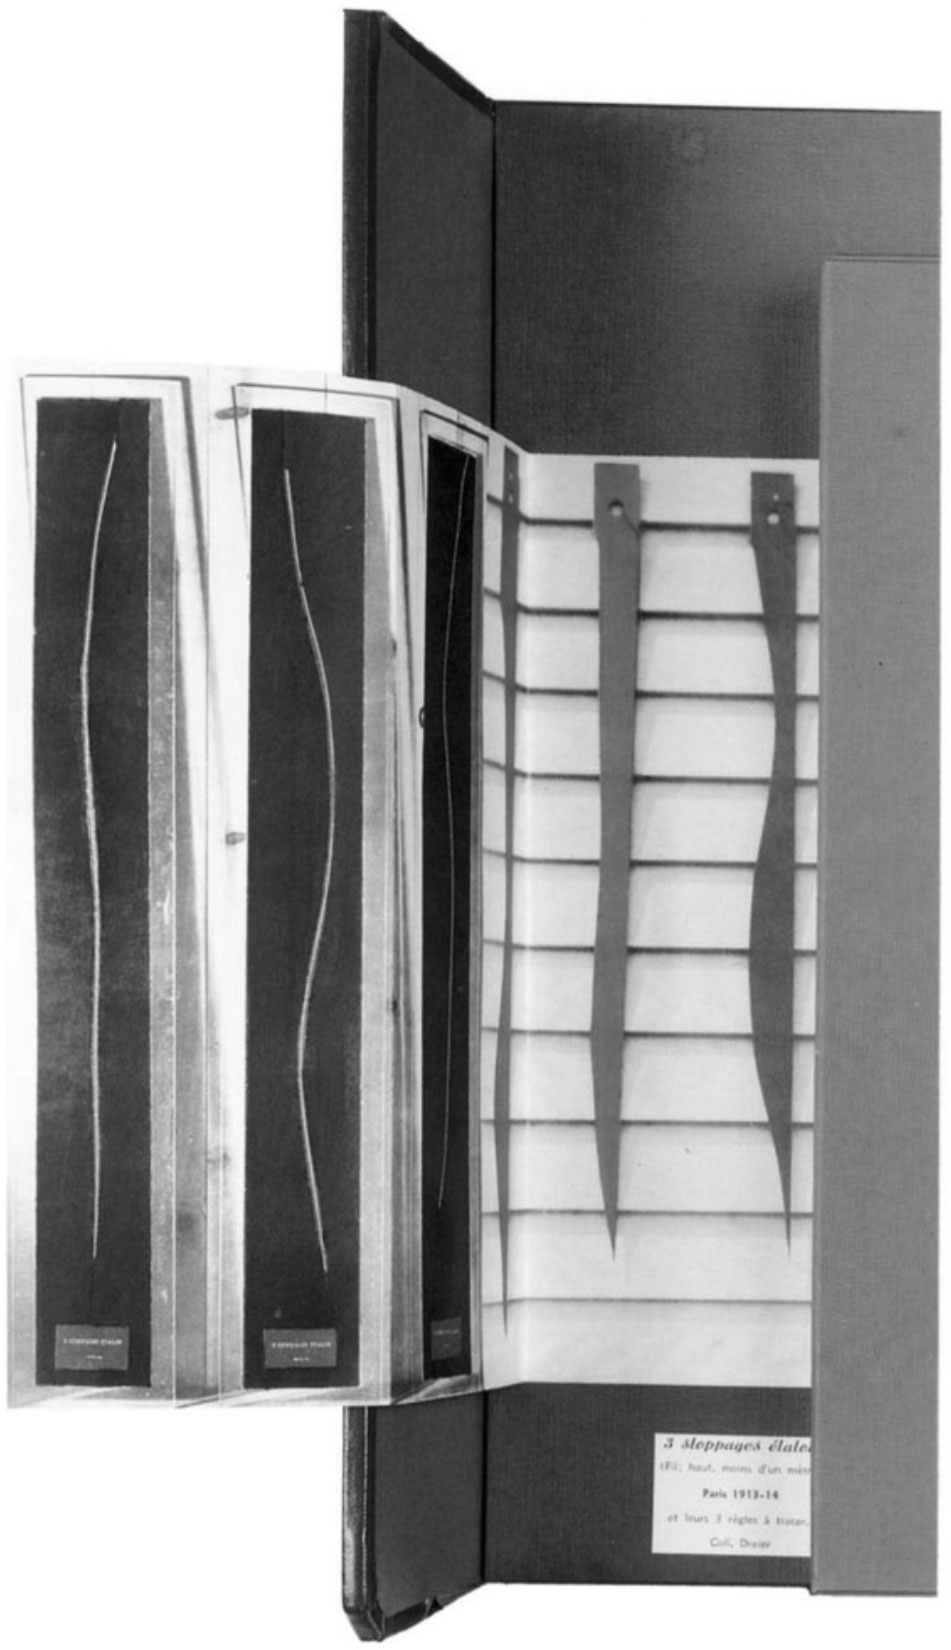
 Marcel Duchamp "Three Standard Stoppages"
Randomness, chance or surprise are the phenomena that have accompanied me in the creative process for a long time. As far as I can remember I tried to create for myself a work environment that embraced surprise. Randomness is also very liberating. As designers, we have a lot of decisions to make, and often there is no single right answer to a given problem. By checking different variants of a given idea, we look for a solution that will meet our expectations and assumptions. This process can be made easier by introducing an element of randomness into the search. Initially, we need to establish limits within which we will allow chance to take its course. The result is a set of solutions from which we can choose one – as the final effect or an intermediate point for further work.
It can also be a powerful tool in creating striking graphics. As humans we tend to search for patterns in everything we see. We are also very bad at creating "random" patterns. Using true randomness can be a way to break these behaviours and create something that will surprise us.
Method
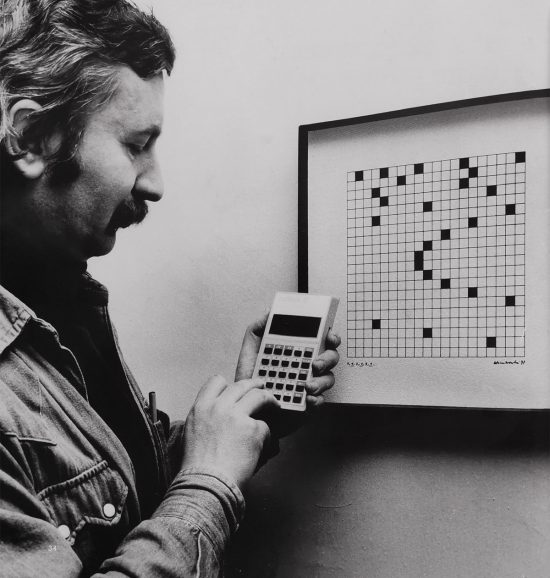
 Ryszard Winiarski
At this point, the experiments are divided into two series: Square and Image. Square concerns the transformation of one of the most basic geometric forms, which is a square. I decided to use only black to focus primarily on form and composition. In some cases, grayscale also appears. At Randomness Explorer, colour manipulation is possible in some exercises but I plan to conduct a full series of colour experiments in the future. The second group concerns image manipulation. Here I also use only black and white photos. In the future, I plan to add further experiments involving other geometric figures or the mentioned colour.
Past
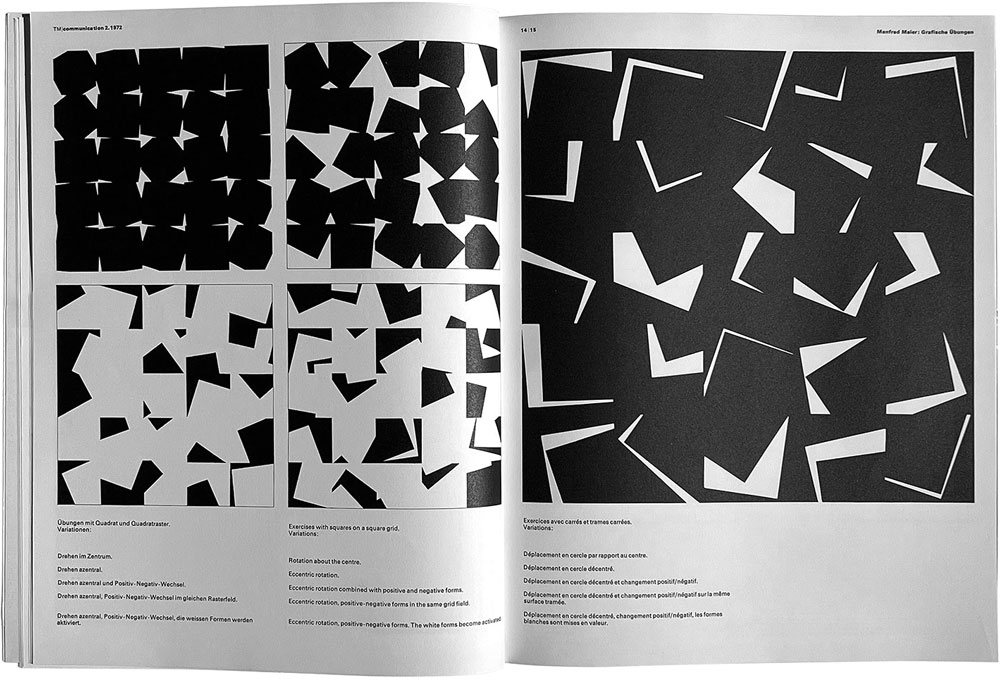
 Manfred Maier
I’ve also discovered the work of Ryszard Winiarski, who used a mathematical system for generating visual forms in his work. Randomness was an essential part of his process. Manfred Maier – a Swiss graphic designer – has created very similar graphics. I admit that these discoveries made me a bit sad. These paintings and graphics were very similar to what I did in terms of method and effect. I wondered whether to stop my search, but I decided to continue it. I came to the conclusion that I discovered this method on my own and I can still get a lot out of it. Maybe continue the idea that inspired them. The thought that these artists and designers were also creating similar works probably without even knowing about their existence also gave me some encouragement.
Acknowledgements
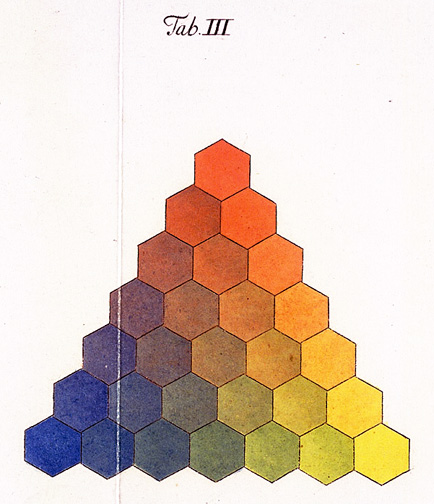
 Georg Christoph Lichtenberg's representation of the three-sided color graph developed by the astronomer and mapmaker Tobias Mayer
Randomness Explorer is for research only but you can use it however you want. If you decide to include the effect in your work please tag me if it’s possible. It's hard to spot bugs when you work with randomness. If you see something that looks off, please let me know. If you have an idea for an experiment also drop me a line.
Colour
For the colour experiments my goal, without any particular reason, was to use a physical method of mixing colours ie. red-blue-yellow or RYB model. I was sure that there is a way of doing that in any graphic program. I was shocked that it is not possible and learned that it’s a complicated calculation for graphic software. For some reason, in my over 20 years of experience, I never questioned why mixing blue with yellow results in grey and not green. While researching that problem I stumbled upon a solution by two Czech developers – Šárka Sochorová and Ondřej Jamriška. They developed a library that allows true pigment colour mixing within the RGB model. It’s called Mixbox and is available for free and I implemented it in my experiments.